When making a crucial business decision, it is only natural to seek out facts and projections to make an informed choice. For most, this means turning to analytics—to data—because “numbers don’t lie.” However, the popular expression is rooted in the belief that numbers cannot hold biases. Yet, how we determine what data to analyze is riddled with imperfections: Is the sample representative? Can this data answer my questions? Do I have the means of analyzing this information? The list goes on.
To address these concerns, good analytics projects spend upwards of 80% of the time conducting data preparation—finding, cleaning, and sending data for analysis. While not as glamorous as analyzing the data itself, data preparation is the bedrock of analytics.
What is data preparation?
Find
Garbage in, garbage out. The first step in preparing data is deciding what to collect and later input in the analytics platform. Finding data requires an ability to precisely search across the enterprise to pluck out relevant information, typically using metadata (user, document age, location, etc.) and content, the textual substance within the data. For example, if you are curious about employee opinion on a new policy, you would have to narrow your collection efforts to just the affected employees’ communications that reference the policy.
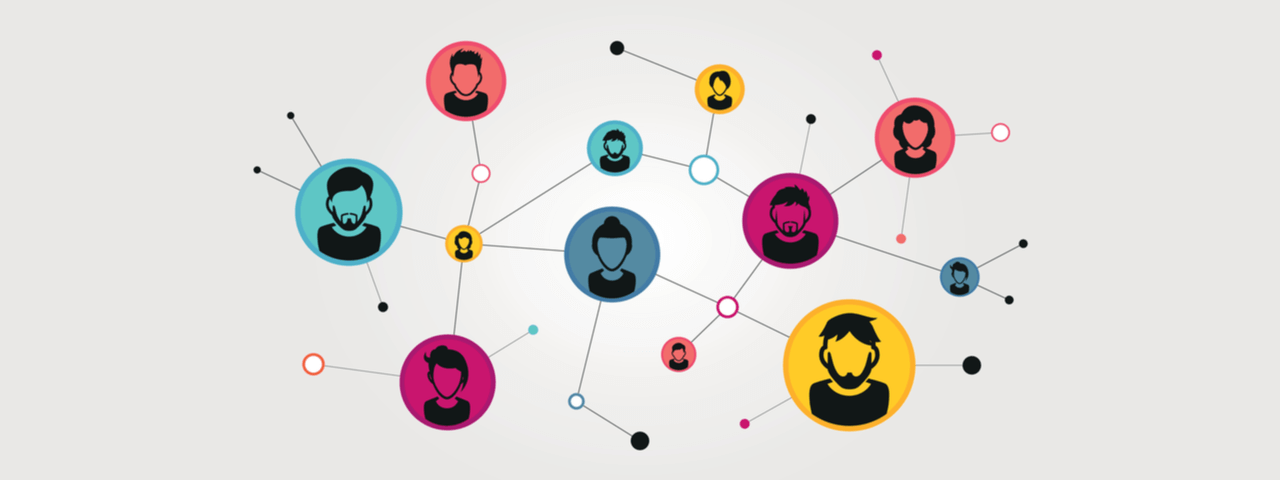
To confirm that the data you collected aligns with what you hoped to find when selecting your search criteria, you have to profile and explore the data. Some baseline hit terms reports (the number of times a particular phrase or word was used) and network maps (who is represented and how they are connected) can show an overview of the collected data. Ideally, in this preliminary review, you will already begin to see patterns and similarities that indicate what you gathered can answer your original questions. However, noticing issues with the data set—inconsistencies, extrema, missing data, or other hazards—can help you refine your search and will serve as the basis for data cleaning.
Clean
Cleaning data, also referred to as scrubbing or cleansing, is the process of making your data usable. This involves remedying the possible issues you found while exploring the data, removing irrelevant, incomplete, and abnormal data points from the set. For projects involving sensitive information, cleaning also requires removing personally identifiable information, as required by privacy laws such as GDPR and CCPA.
An integral part of making data usable is ensuring that it is uniformly structured and organized in a single format. For example, if your analytics project requires both emails and collaboration platform messages, you have to transform them to be the same so that they can be analyzed together.
Confirm and Send
Before sending data off for analysis, you should verify its quality, validity, and accuracy. This stage is similar to exploring and profiling data—which is done before cleaning. Basic data and file analysis can visualize your findings, confirm they are representative of what you want to examine, and ensure there are no issues that could throw the analytics platform off.
With your data set perfectly curated and cleaned, there is nothing left to do but to send it out for analysis. Typically referred to as publishing, this step involves exporting the data set in a usable format (e.g., JSON) to an analytics platform where you can run the tests you desire.
The Importance of Good Data
Your analytics are only as good as your data. Obtaining good data requires the ability to store, manage, and search information across the enterprise. In other words, good data requires established information governance.
As enterprise control over data increases, so too does its ability to conduct analytics. For the most part, current analytics projects are dependent on specific external collection, such as surveys. However, emerging methods go straight to the source and leverage electronic communications and files to understand the workforce. For example, organizations can gauge employee opinion by looking at the average positivity of language used when virtually collaborating. This method elevates analytics from depicting a single moment in time to encapsulating a living picture of the organization that can be updated on an ongoing or ad hoc basis—all while being more accurate and having fewer biases.
Future blogs will continue to expand on the analytics workflow and explore ways to optimize the process for speed, accuracy, and to answer larger, previously unanswerable questions.
Related Posts
Additional Resources
How to avoid re-processing of data?
Master the Art of Efficiency: Quick Technique on Avoiding Data Re-processing!...
Meta-Data Analysis Vs. In-Depth Analysis
Meta-Data Analysis and In-Depth Analysis are both extensively used by organizations. Here is the comparison between the two approaches and…...
Identifying top performers and key innovators with network analysis
From Anecdotes to Insights - Empowering Organizations with Data Driven Talent Management....


